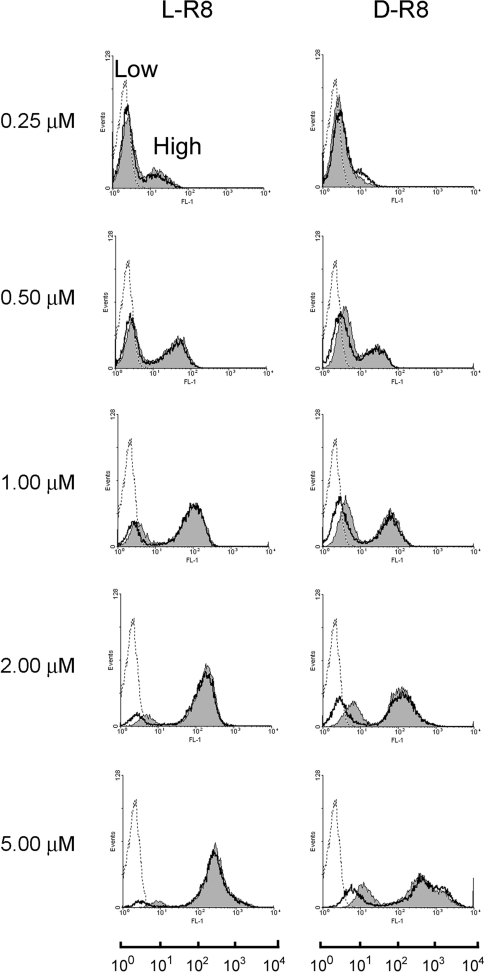
Figure 5. Concentration-dependent cellular fluorescence profiles for R8–Alexa Fluor® 488 peptides.
KG1a cells were incubated for 1 h with 0.25–5.0 μM L- or D-R8–Alexa Fluor® 488 at 4 °C. The cells were then washed and either immediately analysed by flow cytometry (filled grey) or were treated further with trypsin and heparin before analysis (unfilled peaks). Broken lines represent untreated cells. In all experiments performed at 4 °C, two peaks of fluorescence of varying intensities were obtained, and were designated Low and High. The geometric mean values of the two designated peaks were calculated for all conditions, and these were combined with results from repeat experiments to generate Table 1.

