
Figure 3.
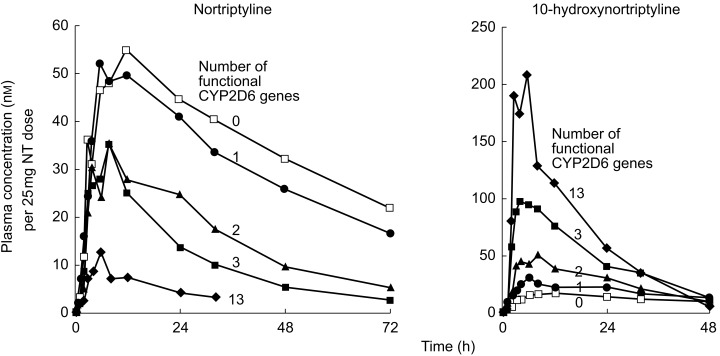
Mean plasma concentrations of nortriptyline (left) and 10-hydroxynortriptyline (right) in different CYP2D6 genotype groups after a single oral dose of nortriptyline. The numerals close to the curves represent the number of functional CYP2D6 genes in each genotype group. In groups with 0–3 functional genes, there were five subjects in each group while there was only one subject with 13 functional genes. Reproduced with permission from Dalén et al.[41].