
Figure 2.
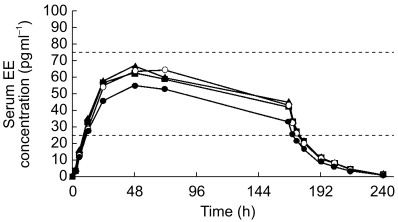
Mean serum concentration vs time profile of ethinyl oestradiol (EE) following successive applications of the contraceptive patch for 7 days at each of the four anatomical sites (• abdomen; ▴ arm; ▪ buttock; ○ torso). Dashed horizontal lines indicate reference range.