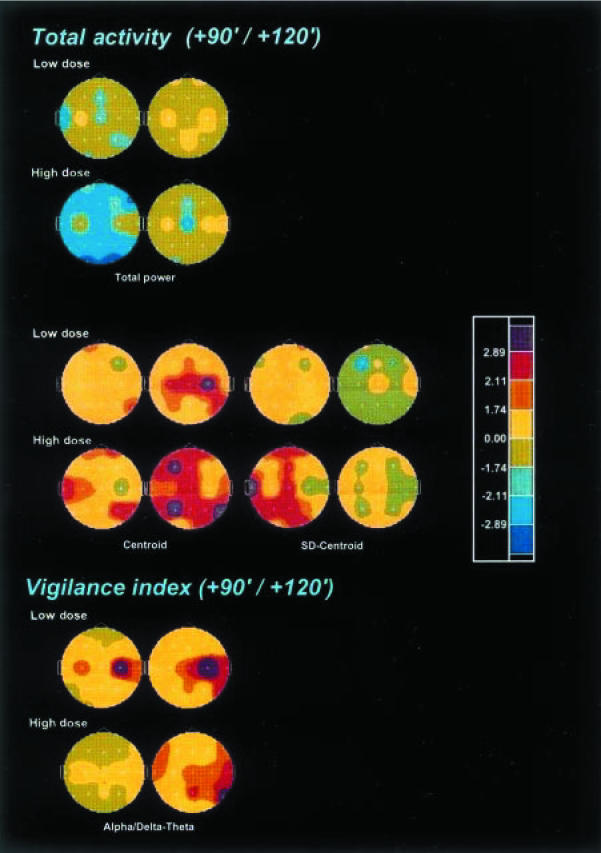
Figure 2.
Significance probability maps showing differences between ayahuasca-induced and placebo-induced changes in total power and frequency variables of the EEG total activity (1.3–30 Hz), and in the alpha/delta-theta vigilance index, after low (upper rows) and high (lower rows) doses of ayahuasca (n = 18) at 90 min (left) and 120 min (right) after administration vs baseline values (PRE-2). The vertex view shows the nose at the top, the left ear to the left, the right ear to the right. Electrode positions are indicated by white dots. Eight-colour scale represents drug-induced changes as compared with placebo based on t-values: lilac, increase at P<0.01; red, increase at P<0.05; ochre, increase at P<0.10; pale yellow, trend towards increase; pale green, trend towards decrease; bright green, decrease at P<0.10; light blue, decrease at P<0.05; dark blue, decrease at P<0.01.

