
Figure 6.
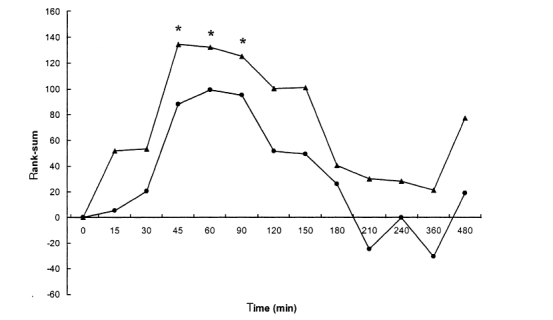
Time-effect relationships after single oral doses of 0.6 mg DMT kg−1 body weight ayahuasca (low dose) [•], and 0.85 mg DMT kg−1 body weight ayahuasca (high dose) [▴]. Plots show differences from baseline values (PRE-2) of sign-adjusted changes in 28 V-EEG variables (rank-sums, means of 19 electrodes, randomized placebo-corrected) from 18 volunteers. An asterisk indicates significant differences form baseline values obtained by means of multiple Wilcoxon.