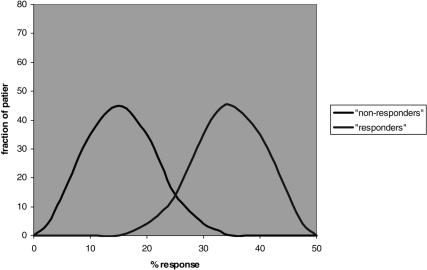
Figure 2.
Hypothetical example of bimodal distribution according to marker that indicates ‘non-responder’ or ‘responder’ status. Note that in both cases a distribution is present, with overlaps, thus, the categorization into ‘responders’ or ‘nonresponders’ based on the marker must be understood to convey only the probability to belong to one or the other group.

