Figure 1.

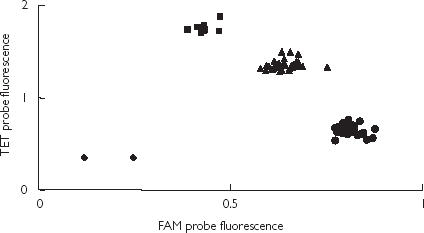
The allelic discrimination of 86 subjects using Taqman® with TET and FAM probes. The genotypes are represented as CYP1A2*1F (•), CYP1A2*1 A/*1F (▴) and CYP1A2*1 A (▪), and nontemplate controls (♦).

The allelic discrimination of 86 subjects using Taqman® with TET and FAM probes. The genotypes are represented as CYP1A2*1F (•), CYP1A2*1 A/*1F (▴) and CYP1A2*1 A (▪), and nontemplate controls (♦).