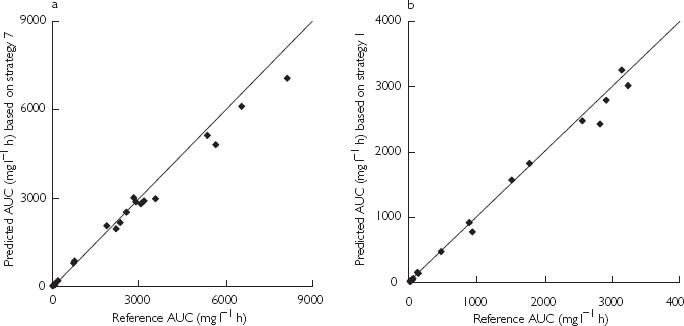
Figure 3.

Predicted values of AUC using the optimal sampling strategies vs reference values of AUC for after a single 1 h infusion schedule (panel a) and after a 1 h infusion daily for 5 days (panel b). The solid line represents the line of identity.
