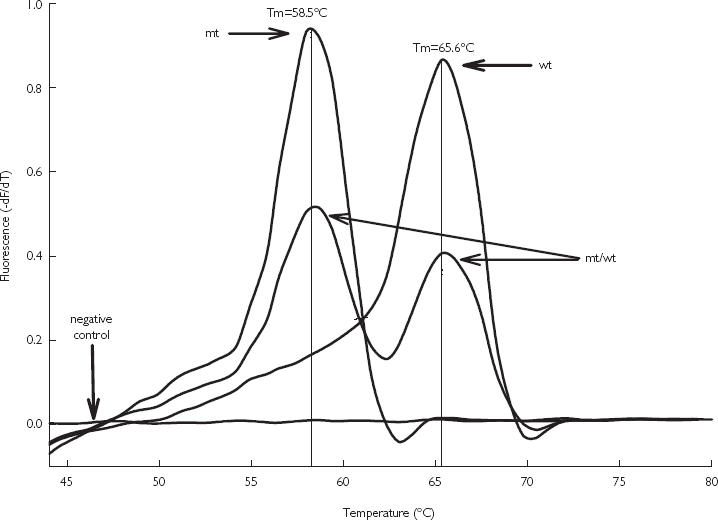
Figure 1.

Melting curve analysis of the CYP2C9*2 variant in the different CYP2C9 genotypes. For easier analysis of the melting peaks, the melting temperature curve is plotted as the first negative derivative of the fluorescence vs temperature (– dF/dT). In the presence of wild-type DNA (wt), hybridization probes form an exact match with the target, resulting in higher stability of the complex and the highest Tm (65.6 °C). A lower Tm was observed in case of the mismatch (58.5 °C), denoting the CYP2C9*2 variant (mt). The heterozygous samples (mt/wt) showed two distinct melting peaks at Tm of 58.5 °C and 65.6 °C. The negative control without template shows no fluorescent signal.
