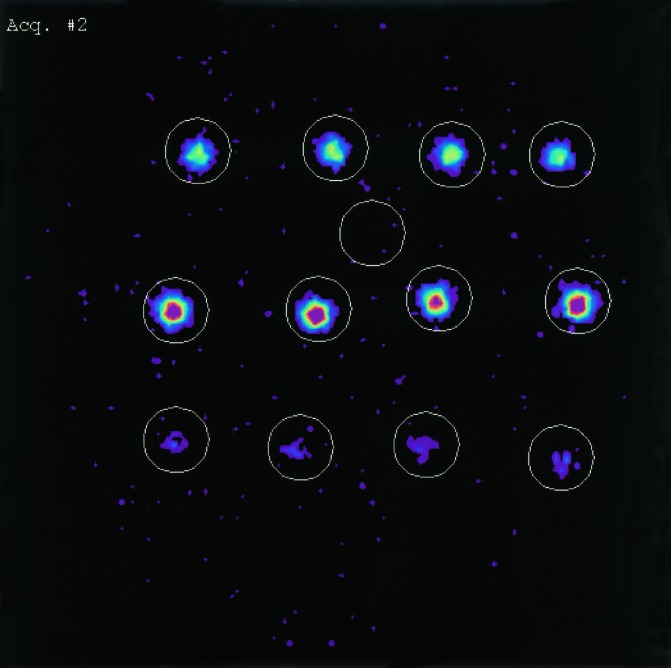
Figure 10.

Blood samples taken over a 3 h period (left to right; Baseline, 1 h, 2 h, 3 h). The upper panel shows whole blood-activity, the middle panel concentrated erythrocyte-activity, and the lower panel the activity in plasma. The single ROI between upper and middle panel serves to correct for background radiation.
