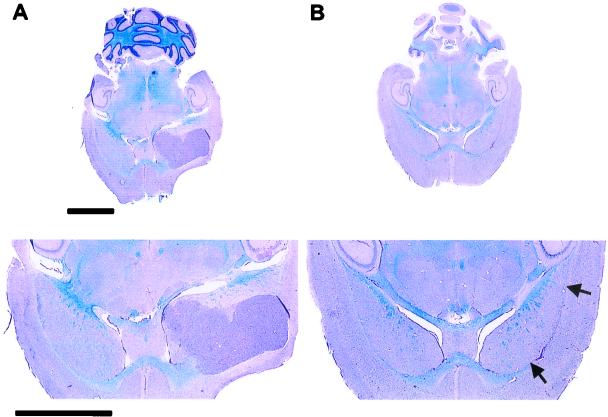
Figure 5.
Histopathological evaluation of intracerebral tumor implantation sites. (Lower) Details of the respective cross sections of the brain. (A) A transversal midcephalic section reveals a large xenograft originating in the area of the anterolateral fornix of an untreated control mouse 22 days after tumor implantation. (B) A midcephalic section through the brain of an athymic mouse treated with a single injection of PV1(RIPO) 12 days after xenograft implantation. The image shows the brain 50 days after tumor induction and 38 days after virus treatment. A large tissue defect delineating the fornix indicates the region of the implantation site (arrows). Apart from this lesion and the presence of reactive infiltrates within the area, no tissue abnormalities or residual tumor can be distinguished. Sections are 12 μm thick (luxol fast blue/periodic-acid-Schiff/hematoxylin stain). (Bars = 3 mm.)

