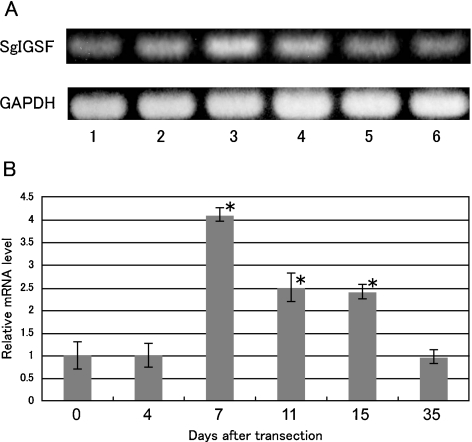
Fig. 2.
Conventional (A) and real-time quantitative (B) RT-PCR analyses for SgIGSF mRNA expression in olfactory mucosa after olfactory nerve transection. (A) Amplified products for total RNA from olfactory mucosa 0, 4, 7, 11, 15 and 35 days after transection Y (lanes 1–6) were electrophoresed and stained with ethidium bromide. A representative result is shown. (B) The relative level of SgIGSF mRNA against GAPDH mRNA at 0 day, arbitrarily set as 1, is plotted against the corresponding values after transection. Each point represents mean±SD of 6 samples. * Significantly different from 0 day value (P<0.05).

