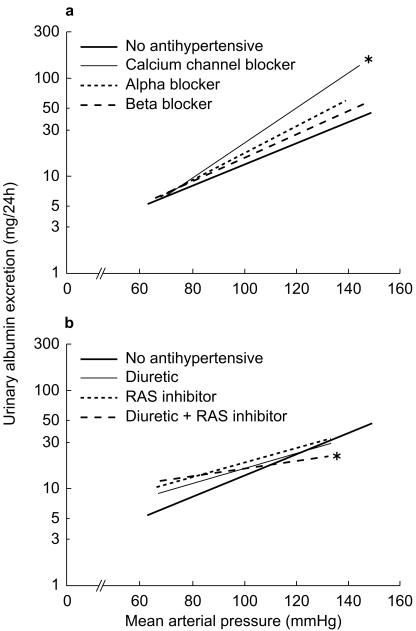
Figure 1.
a) and b) Influence of different antihypertensive drug groups on the relation between blood pressure and urinary albumin excretion. The figure is split in two for clarity. Only the combination between a RAS inhibitor and a diuretic is shown, none of the others had a significantly different slope. *Significantly different slope (P < 0.05) as compared with no antihypertensives. Solid bold line no antihypertensive; Solid thin line a) calcium channel blocker, b) diuretic; thick dotted line a) α-adrenoceptor, b) RAS inhibitor; thick dashed line a) β-adrenoceptor blocker, b) diuretic + RAS inhibitor.

