Figure 3.
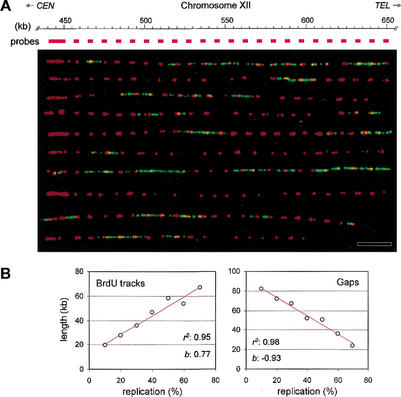
Spatial and temporal distribution of initiation events in yeast rDNA. (A) Alignment of BrdU-labeled rDNA fibers relative to the edge of the array. Genomic DNA prepared from HU-arrested wild-type cells (E1000) was analyzed by DMC as described in Materials and Methods. A 10-kb PCR fragment, located immediately upstream of the array (pos. 441,034–450,816 bp) was used as a FISH probe. Representative fibers are shown. (Red) FISH probes; (green) BrdU. Bar, 50 kb. (B) Wild-type cells (E1000) were released synchronously into S phase from an α-factor arrest. Samples were collected at regular intervals throughout the S phase, and rDNA replication was analyzed by DMC as described in Figure 2. The mean length of BrdU tracks and gaps was scored for 48 rDNA molecules (average size, 470 kb; total, 22.4 Mb) and was plotted as a function of fiber substitution (10%–80%). The coefficient of regression (r2) and the slope (b) of the regression line (red) are indicated for each set of data.

