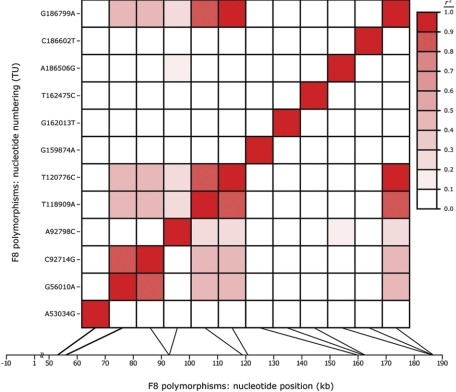
Figure 2.
Pattern and degree of LD across F8. Allelic associations among the 12 functional region F8 polymorphisms variable in at least white VDG subjects were estimated pairwise, based on allele frequencies in the GAIT founders, by calculating both D′ and r2. While only r2 values are displayed here, similar estimates of LD were obtained using D′. The color legend semiquantitatively illustrates r2; white indicates linkage equilibrium (r2 = 0), and red indicates complete LD (r2 = 1). In order to reveal the genic location of each variation with respect to both its position in the transcription unit (y-axis) and physical spacing along the gene, based on hg17 (x-axis), the graph is plotted symmetrically such that the information in analogous positions above and below the diagonal pairwise line-of-identity are identical.

