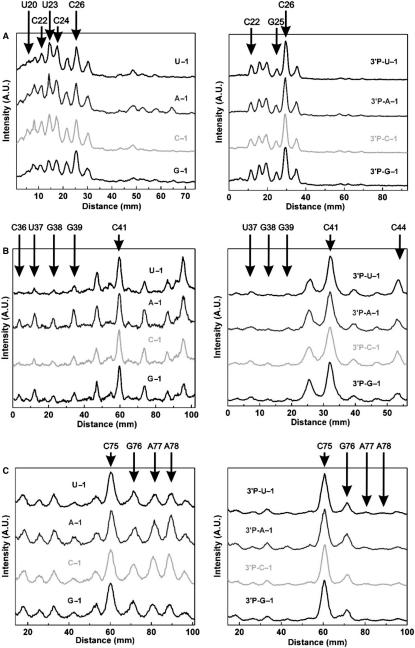
Figure 4.
Quantitative analysis of terbium(III) footprinting patterns of the four cis-acting genomic HDV ribozyme variants (left line graphs, derived from vertical lines through the middle of the gel lanes) and their respective 3′-products (3′P, right line graphs) in the presence of 11 mM Mg2+ and 5 mM Tb3+. The relative scission intensity is given in arbitrary units (A.U.), with important nucleotides indicated 5′ to which Tb3+ cuts. The backbone scission observed in loop L3 reported is (A); stem P1.1 and joiner J1.1/4 (B); and joiner J4/2 (C).

