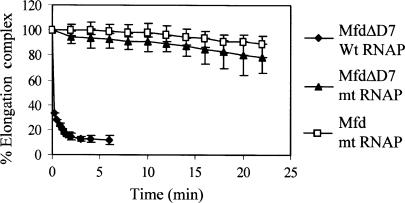
Figure 4.
Displacement of stalled transcription elongation complexes by MfdΔD7 in vitro. Transcription complexes stalled at +20 were formed on an end-labelled fragment of pSRTB1, 250 nM Mfd or MfdΔD7 was added and aliquots were removed and analysed by EMSA. Data points represent the percentage of elongation complex at each time point relative to the amount at t = 0, and are expressed as an average of at least two experiments (shown with data range). The graph shows displacement of wild-type RNAP by MfdΔD7 (filled diamonds) and RNAP βIA117 KA118 EA119 (mt RNAP) by MfdΔD7 (filled triangles) and Mfd (open squares).

