Figure 3.
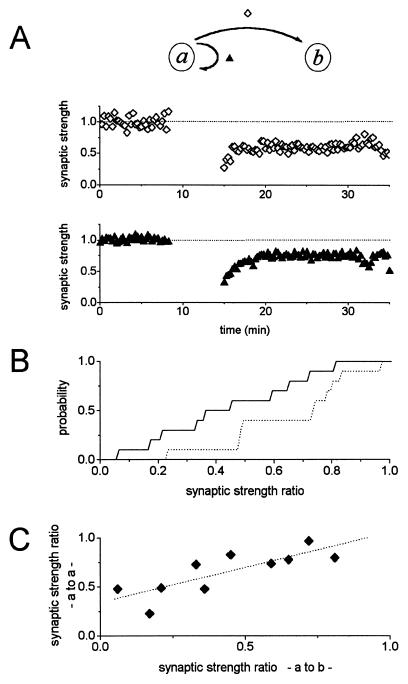
LTD exhibits partial presynaptic specificity in cultured hippocampal neurons. (A) An example cell pair in which LTD was induced from cell a → b. Synaptic strength ratio in cell b following LTD induction protocol was 0.59 relative to the baseline responses (⋄, Top). Autapse of presynaptic cell a also depressed to 0.74 of baseline responses (▴, Bottom). The cells were used at 11 days in culture, and external solution contained 0.5 mM Mg2+ and 10 mM Ca2+. (B) Summary of LTD experiments from 10 cell pairs. The mean synaptic strength ratio was 0.44 ± 0.08 (±SEM) between cell pairs a → b, and 0.65 ± 0.07 (±SEM) for autapses a → a. Autapses displayed LTD to a lesser degree (P < 0.06, Student’s t test). (C) Correlation of extent LTD (synaptic strength ratio) between forward (a → b) and autaptic (a → a) circuit for each cell pair represented in B. Linear regression results in a line shown with slope of 0.71 and y intercept of 0.34 (⋅⋅⋅··, correlation coefficient = 0.81, P < 0.005). The autapses consistently expressed smaller LTD.

