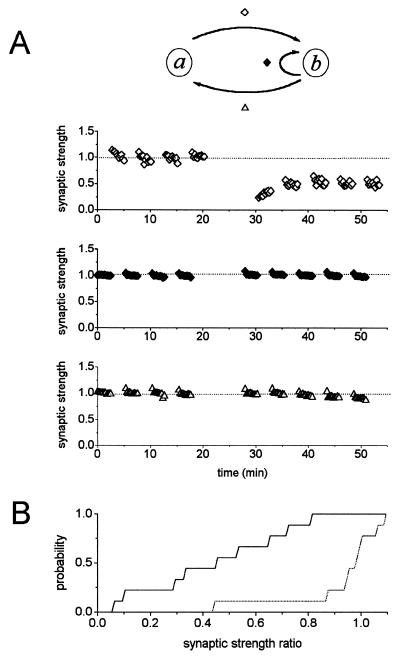
Figure 4.
LTD in culture displays complete postsynaptic synapse specificity. (A) EPSCs of the forward (a → b) and reverse (b → a) circuits, and autapses onto the postsynaptic cell (b → b) were monitored before and after LTD induction in the a → b pathway. Although the a → b input displayed mean synaptic strength ratio of 0.53 after LTD induction (Top), the mean synaptic strength ratio in b → b (Middle) and b → a (Bottom) remained at 1.01 and 0.95 relative to the baseline values, respectively. The cultures were 10 days old, and the recordings were performed in 0.5 mM Mg2+ and 10 mM Ca2+. (B) Cumulative probability distributions of LTD responses from nine reciprocally connected cell pairs. Mean LTD responses for the forward circuit to which LTD protocol was applied, expressed as synaptic strength ratio, was 0.44 ± 0.09 (±SEM, n = 9; —); in contrast, the mean synaptic strength ratio of the reverse circuit was 0.92 ± 0.07 (±SEM, n = 9; ···⋅⋅⋅). Note that not all cell pairs examined had all four inputs: a → a, a → b, b → b, and b → a.

