Figure 1.
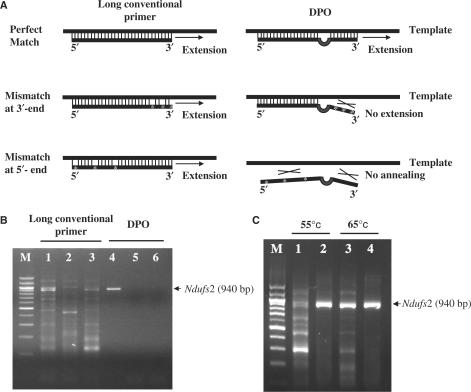
Strategy and validation of DPO-based PCR. (A) Schematic representation of long conventional primer-based and DPO-based PCR strategies. (B) Comparison of 3′-RACE products of Ndufs2 obtained using long conventional primers (left) and DPO primers (right), containing different internal mismatched nucleotides at an annealing temperature of 60°C. Perfect match (lanes 1 and 4), 3 bp mismatches in the 3′-segment (lanes 2 and 5), and 3 bp mismatches in the 5′-segment (lanes 3 and 6). (C) Comparison of 3′-RACE products of Ndufs2 obtained using the perfectly matched long conventional primers (lanes 1 and 3) and DPO primers (lanes 2 and 4) at a low (55°C) and a high (65°C) annealing temperature. M, the 100-bp-size marker (Seegene). The primers are described in Table 1.

