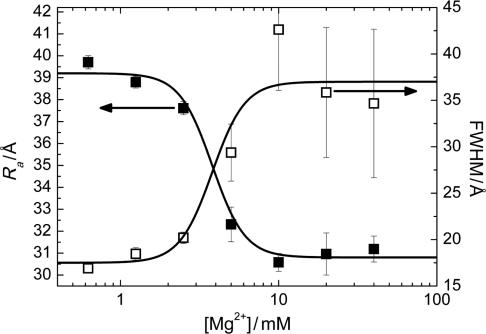
Figure 8.
Mg2+ concentration dependence of the average inter-dye distance Ra (filled squares) and the width of the distance distribution (open squares) of the I state. Solid lines represent a global fit according to the Hill equation, yielding a midpoint Mg2+ concentration of (3.8 ± 0.5) mM and a cooperativity parameter n = 4.2 ± 0.8.

