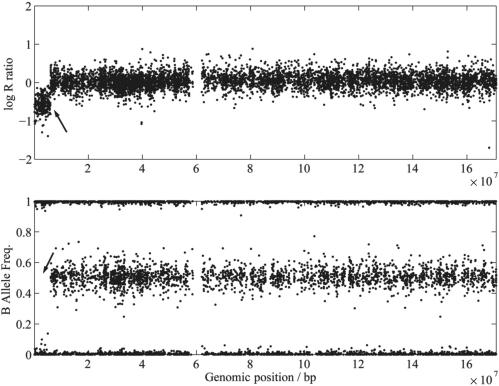
Figure 1.
Chromosome-wide data. Log R ratio values (top) and B allele frequencies (bottom) plotted for each SNP from one individual on chromosome 6. A deletion on the p-arm can be identified by the shift in the log R downwards and the loss-of-heterozygosity indicated by the disappearance of heterozygous state (0.5) in the B allele frequencies (as indicated by the arrows).

