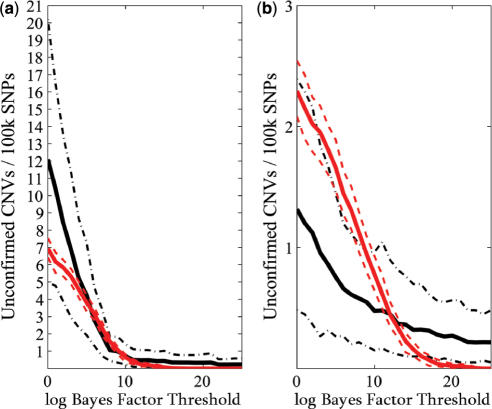
Figure 5.
Calibration of false call rates. Our false call rates obtained by simulation (red) fall within the bounds of the empirical false call rate derived from the experimental sample analysis (black). We chose  for the analysis of the (a) Human-1 and (b) HumanHap300 datasets. Sample 10 was excluded from the analysis as this dataset shown unusually high levels of noise. Errors were derived from bootstrap simulations using the empirical and simulated datasets. There appears to be a good matching between the two boundaries for the Human-1 dataset. The comparison using the HumanHap300 data is less favourable, possibly due to the change in number of probes per SNP in versions of the HumanHap300 used in the experiments (see Supplementary Data, Materials and Methods S1 for details).

