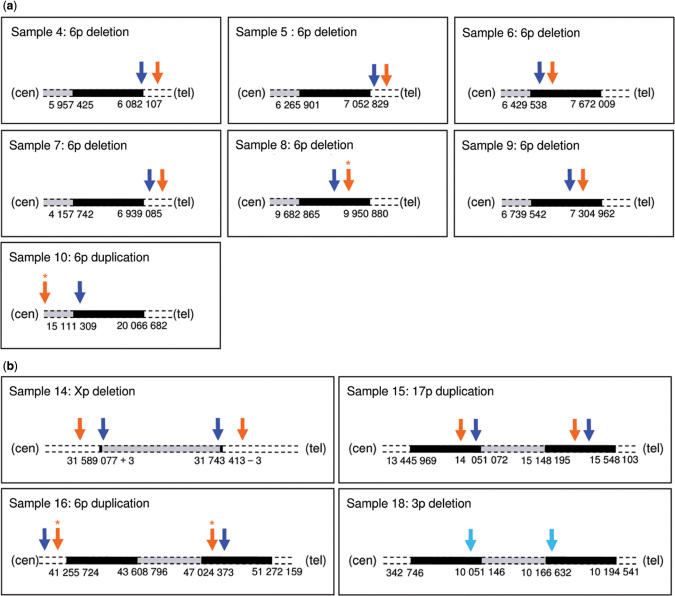
Figure 6.
Breakpoint mapping. Comparison of breakpoint mapping using BeadStudio (orange arrows) and QuantiSNP (blue arrows) on HumanHap300 data shown in context with previous data (full data in Supplementary Table S1B and S2C and Table 1, respectively). A star indicates the detection of the event in multiple fragments. The schematic image of the chromosome is not to scale: other technology defined deletion/duplication boundary is indicated in black, the deleted/duplicated area is in grey (see Table 1 for details). (a) Samples characterized by FISH (boundary mapped with a ±1 00 000 bp confidence). (b) Samples characterized by molecular genetics; sample No. 18 breakpoint was successfully identified above significance (log Bayes Factor = 37.5) in the combined data only (light blue arrows).

