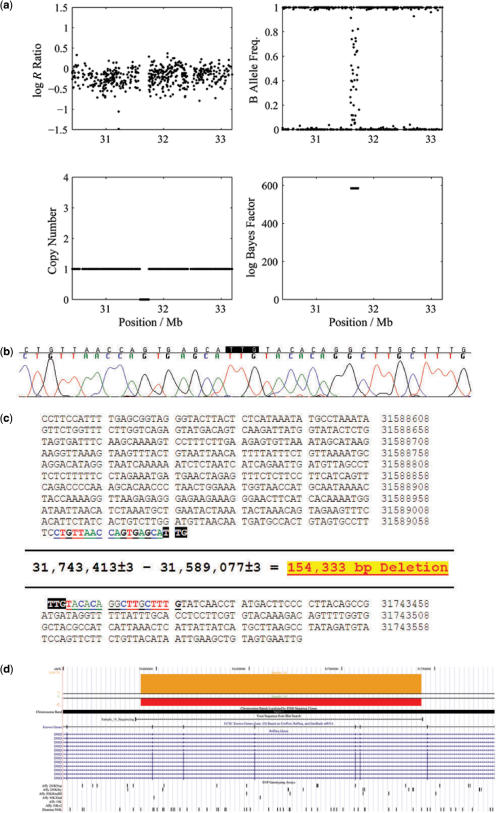
Figure 7.
DMD deletion mapping in Sample 14. (a) QuantiSNP output for sample 14, the chromosome X deletion is identified; (b) Sequence results across the deletion; (c) Mapping of the sequence to the genome location on chromosome X; (d) Blat results for the sequence (in panel c) and the visualization in the UCSC browser. Orange custom QuantiSNP (QS) log Bayes Factor track and in red (deletions)/green(duplications) QuantiSNP (QS) copy number (0 correspond to the normal state). RefSeq genes and SNPs present in different array platforms (including HumanHap300 labelled as ‘Illumina_300 K’) are also shown in the example.

