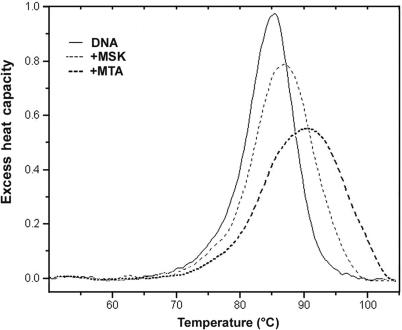
Figure 2.
Differential scanning calorimetry analysis of MTA and MSK complexes with salmon testes DNA. Melting curves for DNA alone and identical DNA solution in the presence of saturating amounts of MTA or MSK (0.2 mol antibiotic/mol DNA (bp)). The plots show the excess of heat capacity (kcal mol−1 K−1) as a function of temperature. The area under the peaks provides direct estimates of the enthalpy for DNA melting and the MTA–DNA and MSK–DNA complexes.

