Figure 4.
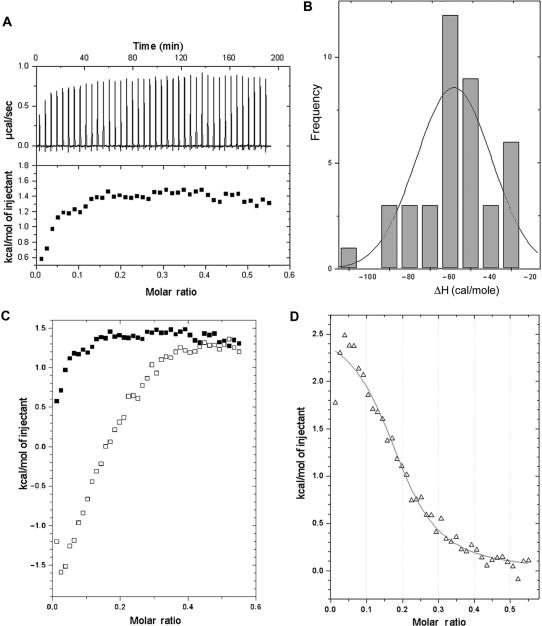
Isothermal titration curves of MTA binding to salmon testes DNA at 25°C. (A) Titration of a Mg2+–MTA complex in HPS buffer (pre-formed in the syringe of the ITC apparatus) into DNA in the same buffer solution without added Mg2+. ITC raw data are shown in the top panel, while the lower panel shows the uncorrected binding isotherm. (B) Heat of dilution of an MgCl2 solution titrated into a DNA solution in HPS buffer. The distribution of the heats of dilution of Mg2+ corresponds to a ΔH ∼ −60 cal mol−1. (C) Heat change induced in an ITC experiment by adding Mg2+–MTA complexes into buffer in the absence of DNA (open squares). The panel also shows the uncorrected isothermal titration curve of the titration of Mg2+-MTA complex into DNA (black squares) redrawn from (A). (D) Corrected binding isotherm resulting from integration with respect to time, with correction for the measurements presented in (B and C) (see also Figure S3). The heats obtained for each injection in (C) were subtracted from the corresponding raw value (open squares) in the same panel.

