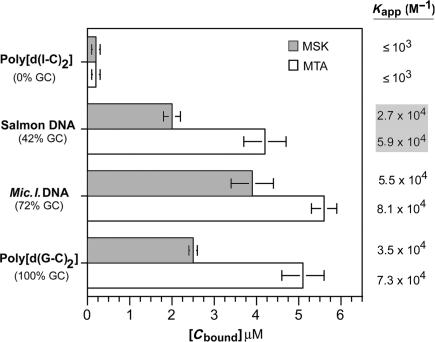
Figure 6.
Competition dialysis experiments using MTA and MSK and various DNAs. Data correspond to experiments performed in triplicate (means ± SD). Values to the right are the apparent binding constants for the displayed DNAs, calculated, as described in the Materials and Methods section, using the bound antibiotic concentrations [Cbound] shown in the figure.

