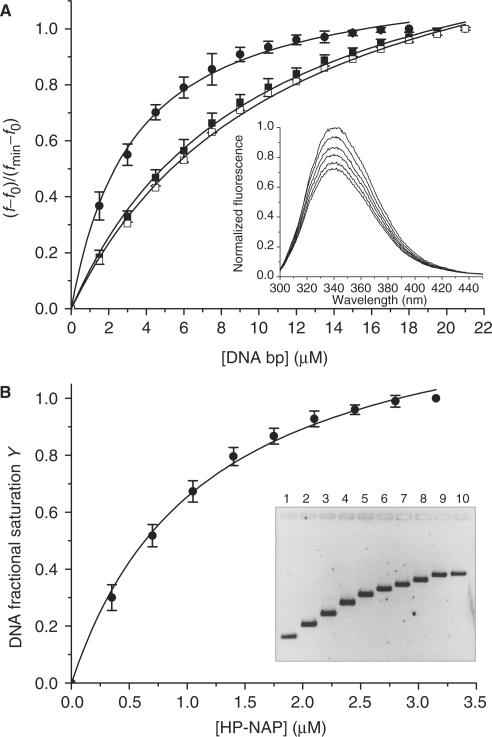
Figure 3.
Analysis of the HP-NAP–DNA interaction at pH 7.5 by means of fluorescence quenching and gel retardation experiments. Panel A: fluorescence data presented as the mean (±SD) of three independent experiments obtained upon titration of 0.5 μM HP-NAP with linearized plasmid DNA (closed circle), a 27 bp dsDNA fragment (closed square) and a 27 nt ssDNA oligonucleotide (open square). A representative experiment is shown in the inset. Panel B: gel retardation data presented as the mean (±SD) of three independent experiments obtained upon titration of 20 nM linearized plasmid DNA with HP-NAP. The inset depicts a typical experiment; the agarose gel was stained with SYBR Green I. At the lowest protein:DNA ratio analyzed (lane 2), there is no free DNA as shown by the AFM image obtained under the same experimental conditions (Figure 2C); consistently, only one DNA band is apparent in the gel which is shifted relative to free DNA. Gel retardation increases with increasing protein concentration because of the increased molecular weight of the nucleo-protein complex. The apparent dissociation constants calculated from the change in mobility are given under ‘Results and discussion section’.

