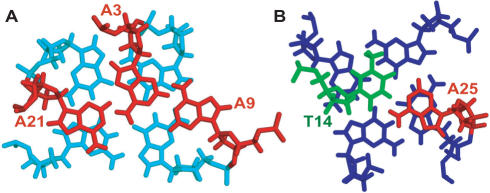
Figure 8.
(A) The top view of the adenine triple (red) capping the top G-tetrad (cyan). The distance is 2.05 Å for A3H62/A21N1, and 2.27 Å for A21H2/A3N7, respectively. (B) The bottom view of the A25:T14 base pair (adenine in red and thymine in green) capping the bottom G-tetrad (blue). Figures are prepared using PyMOL.

