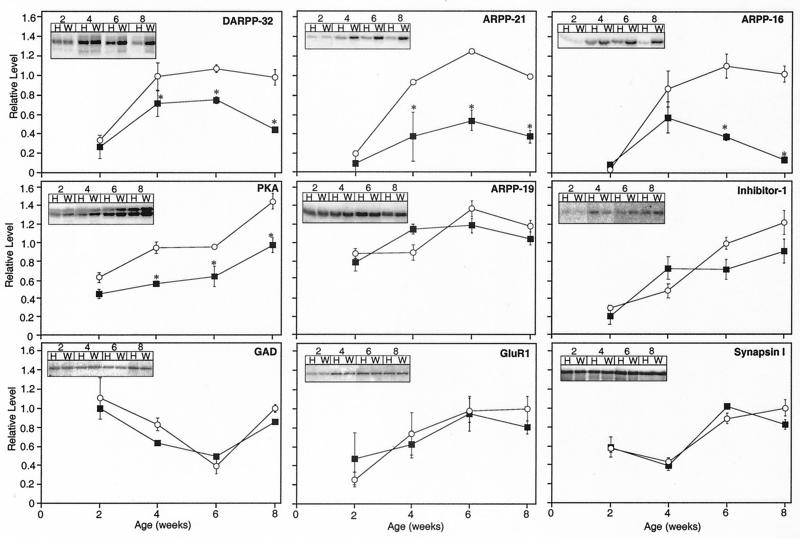
Figure 3.
Comparison of the levels of striatal proteins in WT and HD mice. Striatal homogenates of WT control (○) and HD (■) mice were subjected to SDS/PAGE and examined by immunoblotting with an antibody specific for the protein indicated. Mice were analyzed at 2, 4, 6, and 8 weeks of age. (Insets) Radiographic images showing representative protein bands detected in homogenates of HD (H) and WT (W) mice for each time point. Data represent means ± SEM for n = 6; ∗, P < 0.05 compared with WT.

