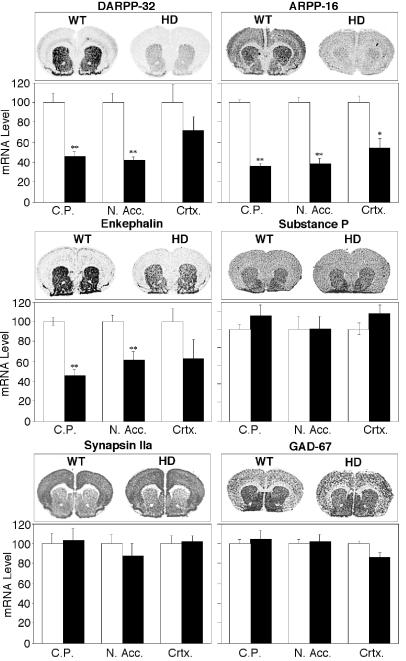
Figure 5.
Comparison of the levels of striatal gene expression in WT and HD mice. In situ hybridizations with probes specific for the detection of DARPP-32, ARPP-16, enkephalin, substance P, GAD-67, and synapsin IIa are shown. Representative labelings of coronal sections are shown for WT and HD mice. Histograms summarize quantification of signals in the caudatoputaman (C.P.), nucleus accumbens (N. Acc.) and cortex (Crtx) for WT (□) and HD mice (■). Data represent means ± SEM for n = 6; ∗∗, P < 0.001 and ∗, P < 0.01 compared with WT.

