Figure 5.
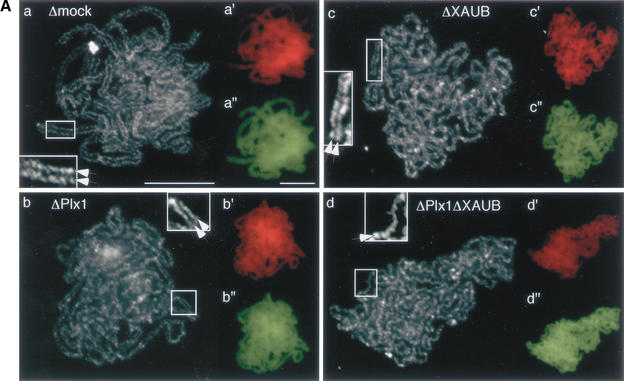
Sister chromatid resolution is defective in the absence of Plx1 and aurora B. (A) Chromosomes were assembled in mock-depleted (a,a‘,a"), Plx1-depleted (b,b‘,b"), aurora B-depleted (c,c‘,c"), and Plx1/aurora B-depleted (d,d‘,d") extracts, as described in Figure 4. Chromosomes were fixed and stained with an antibody against XCAP-E (grayscale images, a–d), DAPI (red, a‘–d‘), and FITC-conjugated avidin (yellow, a"–d"). Boxes show close-ups of chromosomal regions in which the sister chromatids (indicated by arrows) can be clearly seen. (B) Images of individual chromosomes assembled in mock-depleted (a,a‘) and Plx1/aurora B-depleted (b,b‘) extracts. For comparison, two examples of single-chromatid chromosomes assembled in the absence of DNA replication are shown (c,c‘). Chromosomes were stained with anti-XCAP-E (a–c) or FITC-conjugated avidin (a‘–c‘). (C) Quantitative analysis of chromosomes assembled in mock-depleted (left) and Plx1/aurora B-depleted (right) extracts. The distribution of fluorescence intensity (from XCAP-E staining) was measured along lines of fixed length (∼1.8 μm) drawn perpendicular to the path of the sister chromatids at regular intervals along the length of the chromosomes. Y-axis, relative fluorescence intensity of grayscale images; X-axis, distance along the drawn lines, from left to right. Bars: A, 10 μm; B,C, 5 μm.


