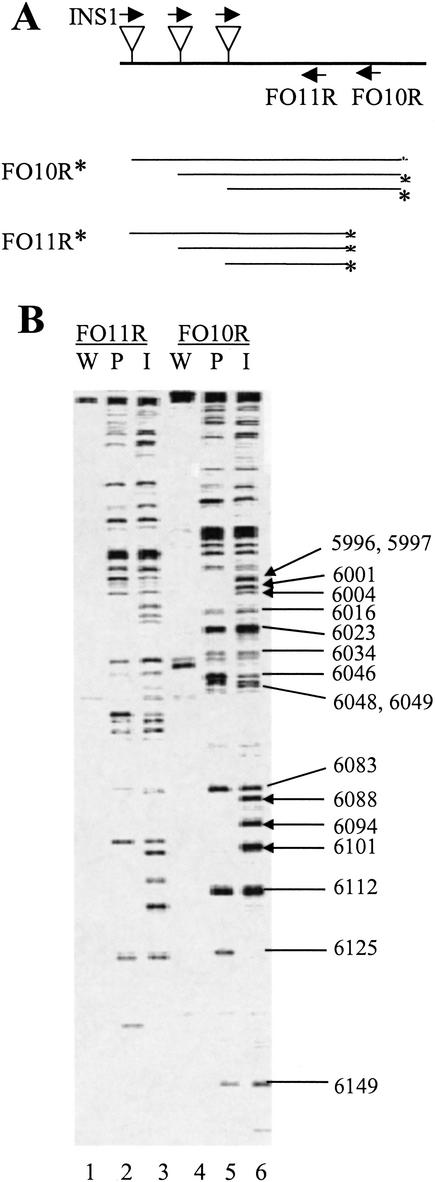
Figure 6.
Collection and analysis of footprinting data. (A) Insertion-specific amplification from the genome segment spanning the region between nt 5152 and nt 6375 was performed using the primer pairs INS1/FO10R (FO10R: 5′-ATTCAACCGACTCTTTCTTCTGTG) and INS1/FO11R (FO11R: 5′-TTCTTCTGTGGTAGTTCAGCATAGT). The products were labeled as indicated by asterisks. (B) The labeled reaction products were analyzed by urea-PAGE. The patterns generated from pPVA-Mu before and after selection for replication in protoplasts are indicated by ‘I’ and ‘P,’ respectively. The patterns from the wild-type clone (pPVA) are indicated by ‘W.’ Genomic location numbers (as in Fig. 5) refer to products labeled with FO10R. Arrows highlight insertions that are missing after selection. Labeling primers are indicated on the top of the gel, and sample numbers are given below each lane.

