
Table 2.
LOD scores, additive effect sizes (“effect”), and percentage of the phenotypic variation explained (% var) for each quantitative trait loci
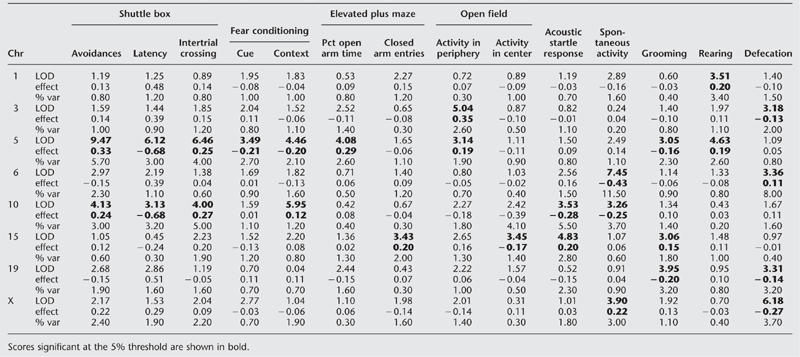 |
Scores significant at the 5% threshold are shown in bold.
Official websites use .gov
A
.gov website belongs to an official
government organization in the United States.
Secure .gov websites use HTTPS
A lock (
) or https:// means you've safely
connected to the .gov website. Share sensitive
information only on official, secure websites.
LOD scores, additive effect sizes (“effect”), and percentage of the phenotypic variation explained (% var) for each quantitative trait loci
|
Scores significant at the 5% threshold are shown in bold.