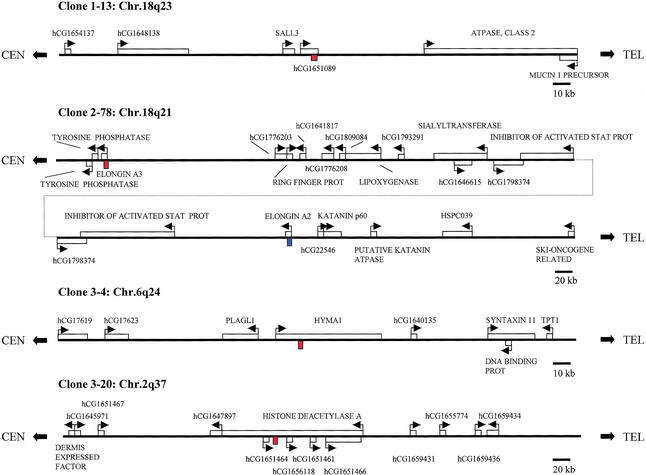
Figure 5.
Chromosomal location and relationship of representative methylated CpG islands to nearby genes. Genes are indicated with boxes, and the arrows show transcriptional orientation. The methylated CpG islands are shown in red. In the case of 2–78, the homologous sequence within Elongin A2 is indicated in blue.

