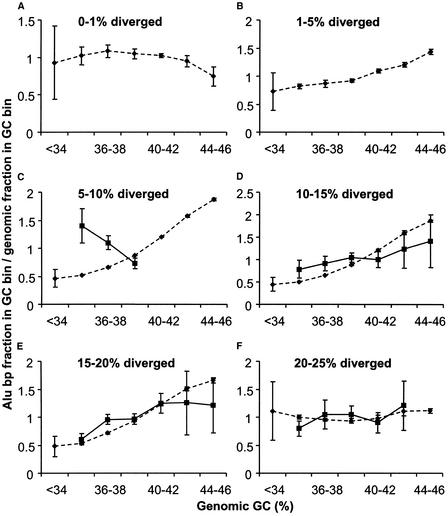
Figure 6.
Density of Alu divergence cohorts in different GC fractions on chromosome Y compared with the whole genome. Solid lines indicate Alu elements on chromosome Y; broken lines represent the Alu density in the whole genome. (A–F) The density of specific divergence classes, which are indicated on the top of each panel. There were insufficient numbers of Alu elements on the Y chromosome in the first two divergence cohorts to be plotted in A and B. The density distribution of each Alu divergence class is plotted against the local 20-kb genome GC content. Standard deviations were calculated as described in Methods.

