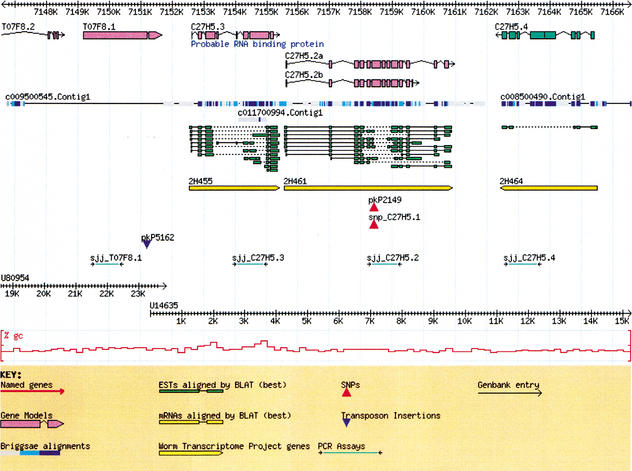
Figure 1.
Rendering a sequence graphically with Bio∷Graphics. This image represents a 20-Kb segment of the C. elegans genome containing annotated genes, a cross-species alignment (C. elegans to C. briggsae), EST alignments, SNPs, PCR primer pairs, and a GC content histogram. The module's flexible glyph-based architecture allows the application programmer to adjust precisely how to display biological objects. Glyphs allow the programmer to define different symbols for different data types or data sources and each are drawn as a separate track in the image. The module is also suitable for illustrating the extent of protein domains, physical (clone) maps, and horizontal maps.

