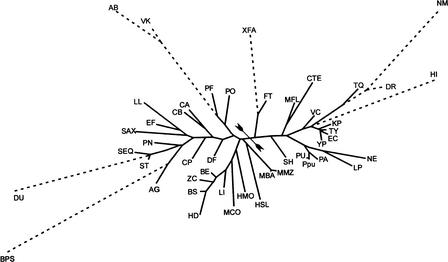
Figure 3.
Maximum likelihood tree of the N-terminal domains of BirA. Domains containing the regulatory HTH motif are shown in solid lines. Other N-terminal domains of BirA (without HTH) are shown as outgroups by broken lines. The proteobacterial and nonproteobacterial subtrees are separated by arrowtail signs. The genome abbreviations are listed in Table 1.

