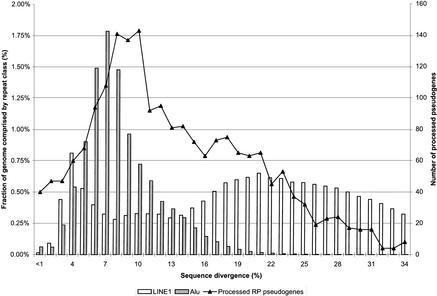
Figure 5.
Distribution of sequence divergence for RP processed pseudogenes in comparison with Alu and LINE1 repeats. Pseudogenes and repeats were grouped into bins according to their sequence divergence from consensus sequences. Each increment in divergence represents roughly 6.6 million years (Myr). The LINE and Alu data are from A. Smit (pers. comm.).

