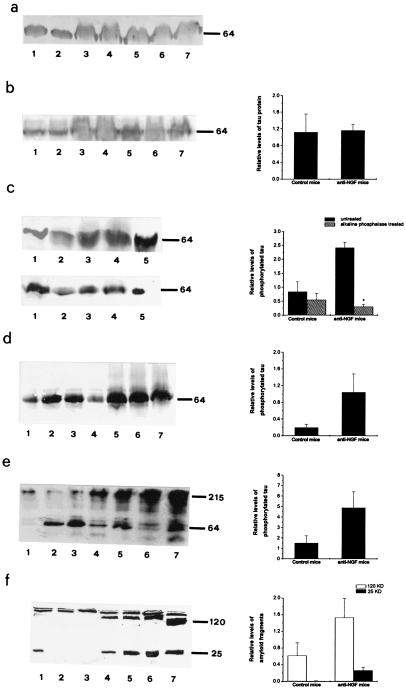
Figure 4.
Western analysis of brain extracts from anti-NGF and control mice. Soluble brain extracts: blots were probed with mAbs YOL1 (a), 7.51 (b), PHF-1 (c Upper), PHF-1 after AP treatment (c Lower), AT8 (d), and anti-APP (f). (e) High molecular-weight PHF-1-immunoreactive τ in insoluble extracts from anti-NGF mice. In a and b and d–f, lanes 1–4 refer to controls and lanes 5–7 refer to anti-NGF mice. In c, lanes 1–2 refer to controls and lanes 3–5 to anti-NGF mice. Graphs report quantitative determinations of the intensities of relevant bands. In e, high molecular-weight immunoreactivity was included in the quantification. In f, two groups of bands were considered separately, around 120 kDa and around 25 kDa, respectively. Data represent the average of three experiments for each antibody. Mean ± SEM is shown (P < 0.05).

