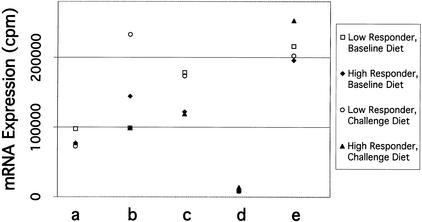
Figure 5.
Analysis of gene expression arrays. DNA fragments, containing gene fragments plus pBluescript SK+ vector, denoted in Fig. 4 (a, b, c, d, and e), were gel isolated, recircularized, and the plasmid DNA for each clone was spotted onto charged nylon membranes in duplicate. For each clone, 3–4 different plasmids were prepared and spotted onto the membrane. Replicate membranes were hybridized, quantified, and normalized as described in Fig. 4. The gene fragment in the array is displayed on the bottom line, corresponding to the gel band (a, b, c, d, or e) in Fig. 4. For each data series, the standard error of the sample mean (i.e., 6–8 values) is indicated in Table 3. Some symbols cannot be seen in the figure because they are partially or completely superimposed on other symbols

