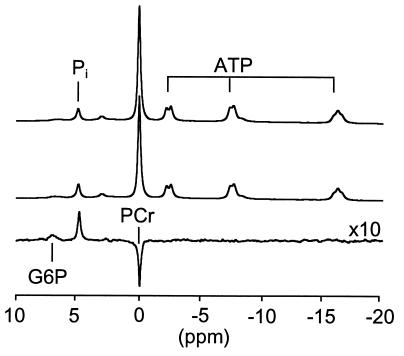
Figure 1.
31P NMR spectra of the human muscle obtained during the euglycemic (top trace) and hyperglycemic (middle trace) clamps for a subject in group IV. In the difference spectrum (bottom trace, hyperglycemia minus euglycemia), an increase in G6P and inorganic phosphate (Pi) and a decrease in phosphocreatine (PCr) are observed. In the spectrum obtained at euglycemia, the G6P concentration was determined by integrating from 7.43 to 7.13 ppm and multiplying the area by 2 (2, 13). The G6P resonance intensity in the difference spectrum corresponds to a concentration difference of 88 μmol/kg of muscle.

