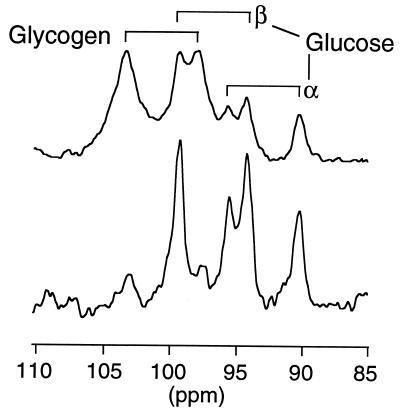
Figure 2.
13C NMR spectra (110- to 85-ppm region) of the human muscle obtained during the second hour of a hyperglycemic hyperinsulinemic clamp for a subject in group III. Upper curve, pulse-acquire spectrum with TR = 400 ms (3,000 scans); lower curve, spin-echo spectrum with TE = 15 ms and TR = 1.2 s (1,000 scans). The dramatic reduction of the glycogen signal facilitates glucose signal quantitation.

