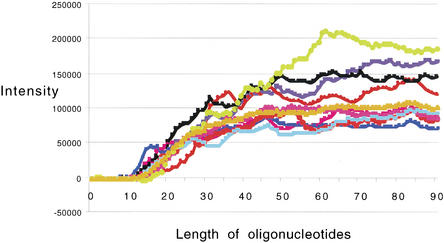
Figure 4.
Hybridization to 1mer to 90mers. Plot of relative intensity from a hybridization to a custom array containing probes to 20 Drosophila genes. The perfect match value (with mismatch data subtracted) is shown. Each gene had a set of probes that ranged from 1 to 90 bases long. The array was hybridized to a biotin-labeled cRNA sample from Drosophila. After hybridization, the array was stained with streptavidin-cy3.

