Figure 2.
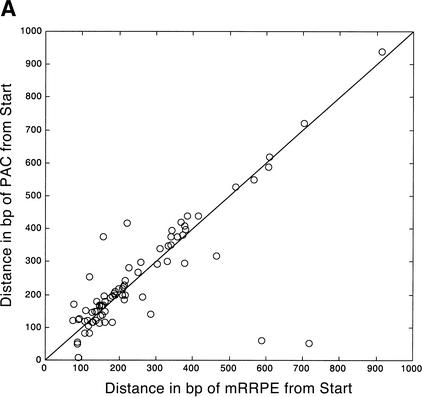
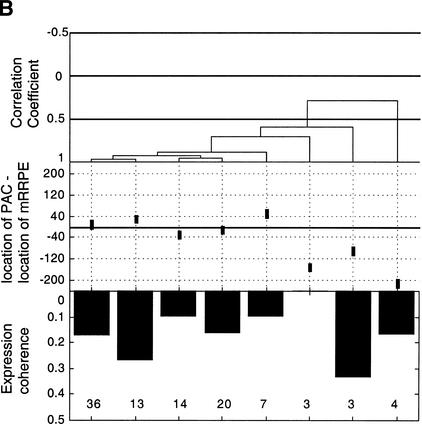
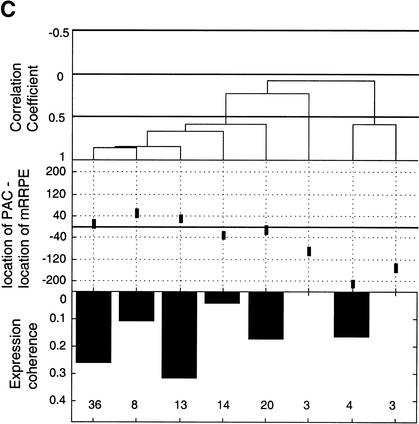
Position vs. expression coherence and expression profile similarity. (A) Scatter plot showing the positional and orientational bias in mRRPE and polymerase A and C (PAC) co-occurring pairs. All distances of mRRPE and PAC are relative to the translational start site (ATG). Most of the points fall near the diagonal indicating that mRRPE and PAC are in close proximity within promoters. The orientational bias is demonstrated by points that fall above the diagonal indicating that mRRPE is closer to the ATG. (B, C) Modified Combinogram of the sporulation (B) and DNA damage (B) datasets analyzing the expression coherence and similarity of genes containing mRRPE and polymerase A and C (PAC) at different relative positions and orientations in their promoters. The middle section shows the range of distances between the mRRPE and PAC sites in 20-bp increments. Each vertical column represents a single gene set containing mRRPE and PAC within a particular distance range and orientation. The distances were generated by subtracting the distance of PAC from the ATG in b.p. from the distance of mRRPE from the ATG in b.p. Thus, positive differences indicate that mRRPE is closer to the ATG and negative differences indicate that PAC is closer. The top section of the figure shows the dendrogram analysis that assesses the similarity in expression profiles of each gene set using Pearson correlation coefficients (C.C.) between the average expression profile of the genes in the set as a measure of distance. The bottom section of the graph shows the expression coherence scores for each gene set. The numbers at the bottom of the expression coherence bars indicate the number of genes containing the motifs in the given distance range.


