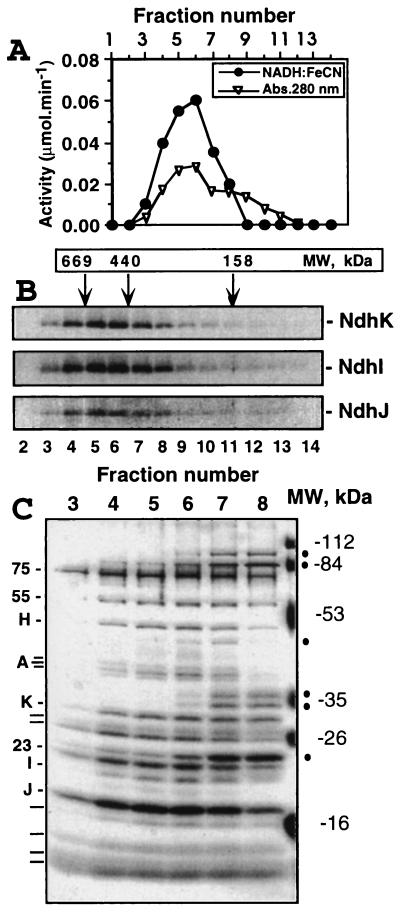
Figure 3.
Size-exclusion chromatography of the Ndh complex. The peak fraction after the Mono Q step (fraction 3) was concentrated and applied to the Sephacryl S-300 HR column. (A) Assay of all fractions containing protein (estimated by absorbance at 280 nm) for NADH:FeCN activity. (B) Immunoblot analysis. The same fractions separated by SDS/PAGE and probed with antibodies specific for NdhK, I, and J. Positions corresponding to the elution of the molecular mass standards are indicated by arrows. (C) Silver-stained SDS/PAGE gel. The coeluting subunits of the Ndh complex, some of which were identified (see text), are indicated on the left. Several impurities of smaller total molecular mass are marked by dots on the right. Positions of molecular mass markers are also indicated on the right.

