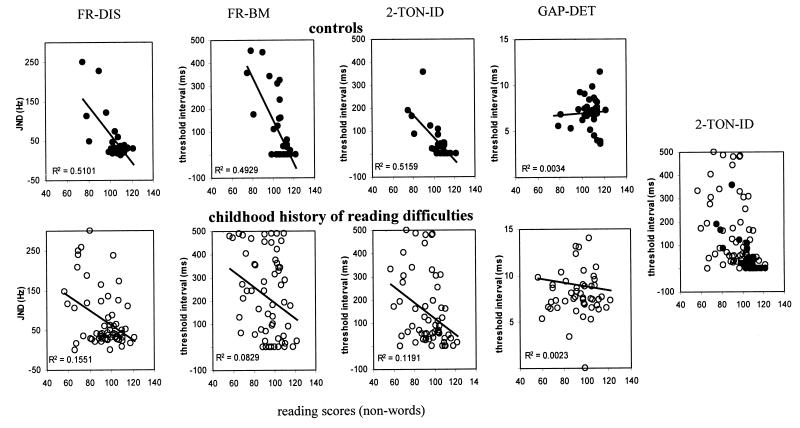
Figure 2.
Scatter plots showing the relationship between single nonword reading standard scores and psychoacoustic thresholds for the control group (Upper; filled circles) and the CHRD group (Lower; open circles). Data are shown for frequency discrimination (FR-DIS), frequency discrimination under backward masking (FR-BM), two-tone identification (2-TON-ID), and gap detection (GAP-DET).

