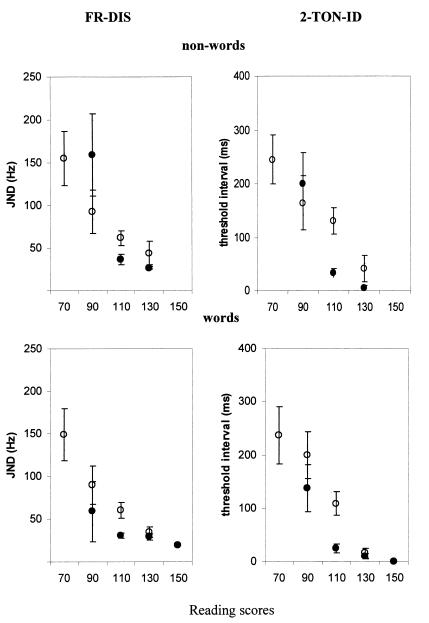
Figure 3.
Average thresholds for the control group (filled circles) and the CHRD group (open circles) in frequency discrimination (FR-DIS, Left) and two-tone-sequence identification (2-TON-ID, Right) grouped by single word (Lower) and nonword (Upper) reading scores according to the bins shown in the distributions of Fig. 1. Bars denote standard errors.

