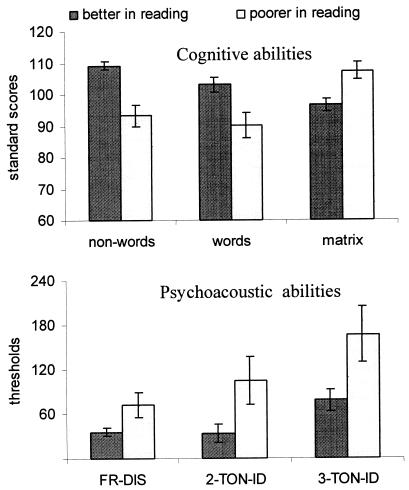
Figure 5.
(Upper) Single nonword and word reading and nonverbal intelligence scores for the good reader and poor reader groups (see text). (Lower) Mean thresholds for these groups with frequency discrimination (FR-DIS), two-tone sequencing (2-TON-ID), and three-tone sequencing (3-TON-ID). Several criteria for defining the two groups all yielded similar results.

